Embedding data widgets on external sites
This article describes how to embed Datto Networking information and widgets into an external website.
Environment
- Datto Networking
Description
You can use the Datto Networking Portal to create a custom HTML script that references the portal's widgets and networking information, and embed this script on an external website, such as a client portal or dashboard. This white-label integration allows for clients to view a tailored, high-level overview about your network without providing them direct access to the Datto Networking Portal.
Currently, the script supports the following widgets and tables:
- Network map
- 24 hour client table
- 24 hour upload/download/clients histogram
- Access point table
- Access point table (compact)
- Application data pie chart
- Application data table
- Site survey table
Procedure
1. Navigate to a web session for your network.
2. Click the Configure drop-down, then click Display.

Figure 1: Navigating to Display
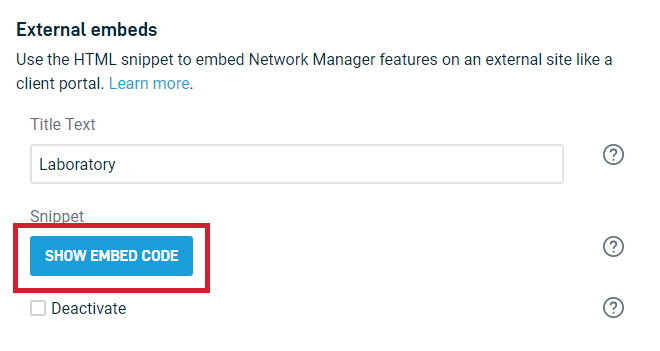
2. Generate a HTML snippet by clicking Show embed code.
This snippet contains a script that connects your page to the Datto Networking Portal, and the generation process automatically fills in the data-key, data-token, and data-network-id values that represent your network. Below is an example script:
<script data-key="abc" data-token="123" data-network-id="1" src="https://embed.cloudtrax.com/v1.js"></script>
3. Open your web page in an HTML editor.
4. Paste the HTML snippet into your page's HTML code.
5. Insert <div> tags for widgets and chart you want to see on the page. Below are the <div> tags for each widget and chart:
<!-- pie chart of layer 7 data --><div class="cloudtrax-ApplicationPieChart"></div><!-- table of layer 7 data --><div class="cloudtrax-ApplicationTable"></div><!-- up/down/clients for given network over 24h period --><div class="cloudtrax-NetworkHistogram"></div><!-- google map with nodes on it --><div class="cloudtrax-NetworkMap"></div><!-- table of all access points --><div class="cloudtrax-NodeTable"></div><!-- table of all access points with some columns removed for a more compact width --><div class="cloudtrax-NodeTableCompact"></div><!-- table of all network users --><div class="cloudtrax-ClientTable"></div><!-- table of other signals detected by the network --><div class="cloudtrax-SurveyTable"></div>
6. Repeat steps 2-6 for each additional page.
Additional Options
Usage Timeframe
By default the timeframe for each DIV element is for the last day only; however, you can change this default behavior (to last 30 days) by specifying the following on each <div>:
<div class="cloudtrax-NetworkHistogram" data-period="month"></div>
CSS
You can modify the CSS styles of widgets and tables. Only modify these with a prior understanding of CSS.
The following is an example of how to add and remove the MAC address client table:
.cloudtrax-NodeTableCompact .mac {
  display:none;
}
.cloudtrax-ClientTable .os {
display:none;
}
Tokens
You can use the data-key and data-token attributes to tie together multiple networks to a page, and define which will take precedence in the script. For example:
<script data-key="abc" data-token="123" data-network-id="1" src="https://embed.cloudtrax.com/v1.js"></script><!-- uses key/token abc/123, as specified by the SCRIPT tag above --><div class="cloudtrax-NodeTable"></div><!-- uses key/token xyz/246, as specified by the data-token attribute --><div class="cloudtrax-SurveyTable" data-key="xyz" data-token="246" data-network-id="2"></div>
Deactiviating embeds
You can permanently deactivate external embeds by selecting the Deactivate checkbox in the Display page of the Datto Networking Portal.


